R to Python: How to use pandas if you love dplyr
Why?
My first data analytics language is R, and I love it because it makes data wrangling and visualization neat and easy. Python was getting more popular for data science, so I decided to learn it, too. The transfer process was painful at the beginning because pandas seemed overcomplicated in comparison to dplyr. But now I know some tricks on how to process data in pandas as enjoyable as in dplyr!
Dataset
I used Walmart Data-Retail Analysis data from Kaggle. It contains weekly sales in Walmart stores from Feb 5, 2010, to Oct 26, 2021.
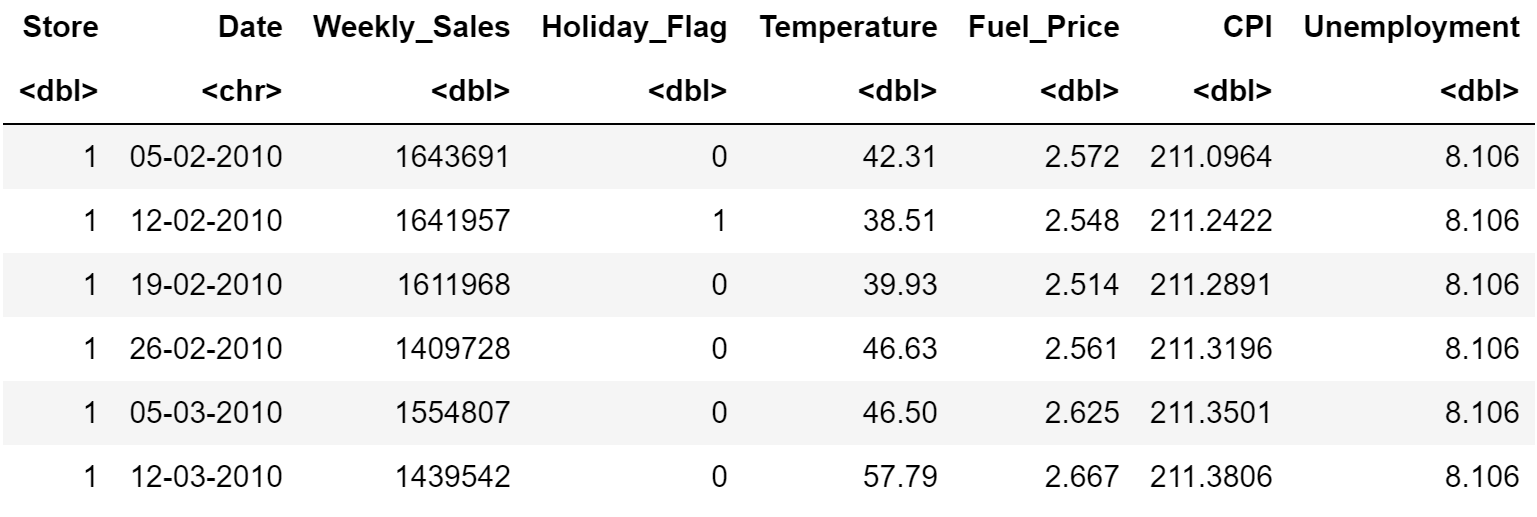
Translation of main dplyr functions to pandas
Data overview
dplyr
head(df)
glimpse(df)
pandas
df.head()
df.info()
Select columns
dplyr
select(df, Store, Date, Weekly_Sales)
pandas
df[['Store', 'Date', 'Weekly_Sales']]
Filter rows
dplyr
filter(df, Store == 1)
pandas
df.query('Store == 1')
df[df['Store'] == 1]
Sort rows
dplyr
arrange(df, -Weekly_Sales)
pandas
df.sort_values('Weekly_Sales', ascending=False)
Create or modify columns
dplyr
mutate(
  df,
  Date = lubridate::dmy(Date),
  Weekly_Sales_K = Weekly_Sales / 1000
)
pandas
df.assign(
  Date = pd.to_datetime(df['Date']),
  Weekly_Sales_K = df['Weekly_Sales'] / 1000
)
Rename columns
dplyr
rename(df, is_holiday = Holiday_Flag)
pandas
df.rename(columns={'Holiday_Flag': 'is_holiday'})
Groupby and summarise
dplyr
group_by(df, Store) %>%
  summarise(total_sales = sum(Weekly_Sales))
pandas
(
  df
  .groupby('Store')
  .agg(
      total_sales = ('Weekly_Sales', 'sum')
  )
)
Window functions
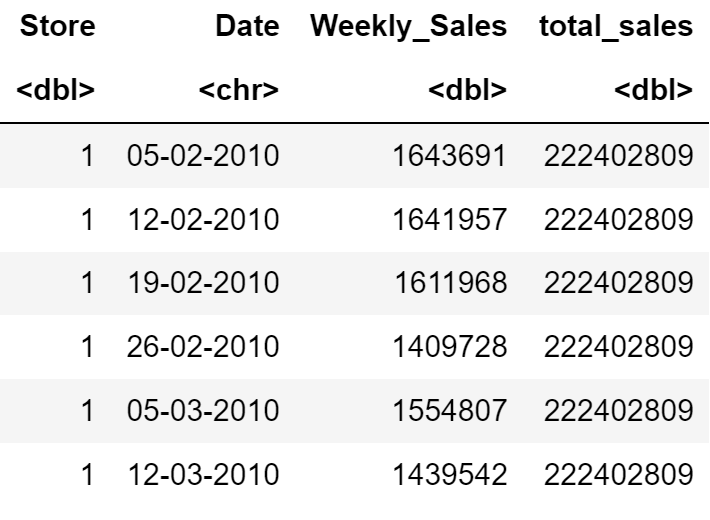
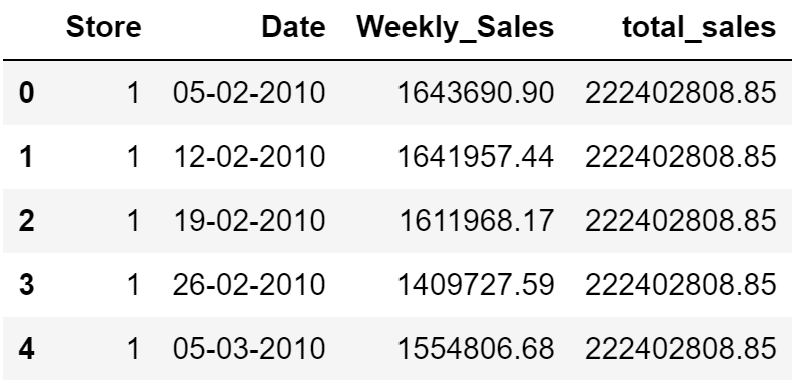
Let’s add a column with total sales per week.
dplyr
df %>%
  group_by(Store) %>%
  mutate(total_sales = sum(Weekly_Sales))
pandas
(
  df
  .assign(
      total_sales = df.groupby('Store')['Weekly_Sales'].transform('sum')
  )
)
dplyr pipes and pandas method chaining
The real magic begins with R %>% pipes, which let you pass any object to the function. That’s what I missed the most in pandas, but you know what? They have a pretty good alternative – method chaining, it’s basically the same as %>% but with . sign. We already used it in the above examples.
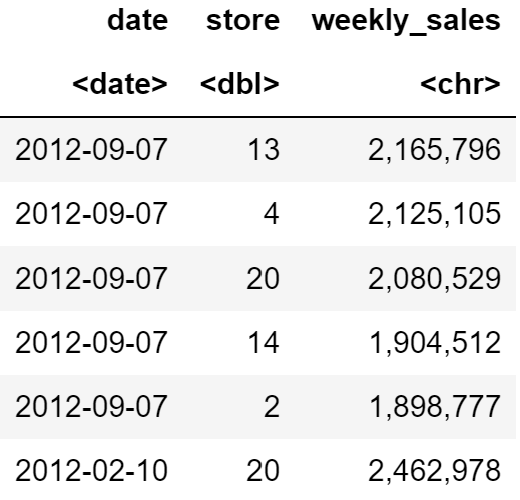
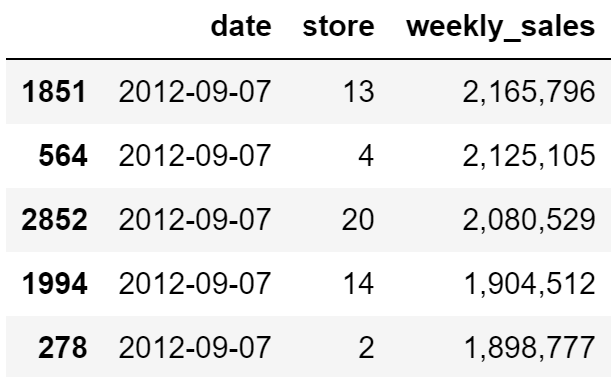
Now let’s select top-5 stores per holiday week based on sales!
dplyr
df %>%
  select_all(tolower) %>% # All column names to lower case
  filter(holiday_flag == 1) %>% # Filter out only holiday weeks
  select(date, store, weekly_sales) %>% # Select needed columns
  mutate(date = lubridate::dmy(date)) %>% # Convert Date from string to date type
  arrange(desc(date), -weekly_sales) %>% # Add descending sorting by date and sales
  group_by(date) %>%
  top_n(5) %>% # Top-5 stores based on Weekly Sales
  mutate(weekly_sales = scales::comma_format()(weekly_sales)) # Adjust number format for readability
pandas
def lower_names(df):
  df.columns = df.columns.str.lower()
  return df

(
  df
  .pipe(lower_names) # All column names to lower case
  .loc[lambda x: x['holiday_flag'] == 1] # Filter out only holiday
  [['date', 'store', 'weekly_sales']] # Select needed columns
  .assign( # Convert Date from string to date type
      date = lambda x: pd.to_datetime(x['date'], format='%d-%m-%Y')
      )
      .sort_values(by=['date', 'weekly_sales'], ascending=False) # Add descending sorting by date and sales
      .groupby('date')
      .head(5) # Top-5 stores based on Weekly Sales
      .style.format({ # Adjust formats for readability
        'weekly_sales': '{:,.0f}',
        'date': '{:%Y-%m-%d}'
  })

)
A couple of notes
- if you are missing any functions in pandas, no problem, you can create your own and pass it to pipe() as we did with
lower_names() - as you may have noticed, the
lambda xexpression is common in method chaining, wherexis the dataframe itself. The difference from the initialdf(because why not just use it?) is thatxis passed from the previous step, so it’s processed accordingly.