How to analyze your Netflix activity using Pandas and IMDb data
How to get the data
I recently learnt that one can request from Netflix all personal data that they store about you, more about this on Netflix Help Center or go to Get My Info page directly. It took me one day from the data request to receiving the data.
Data overview
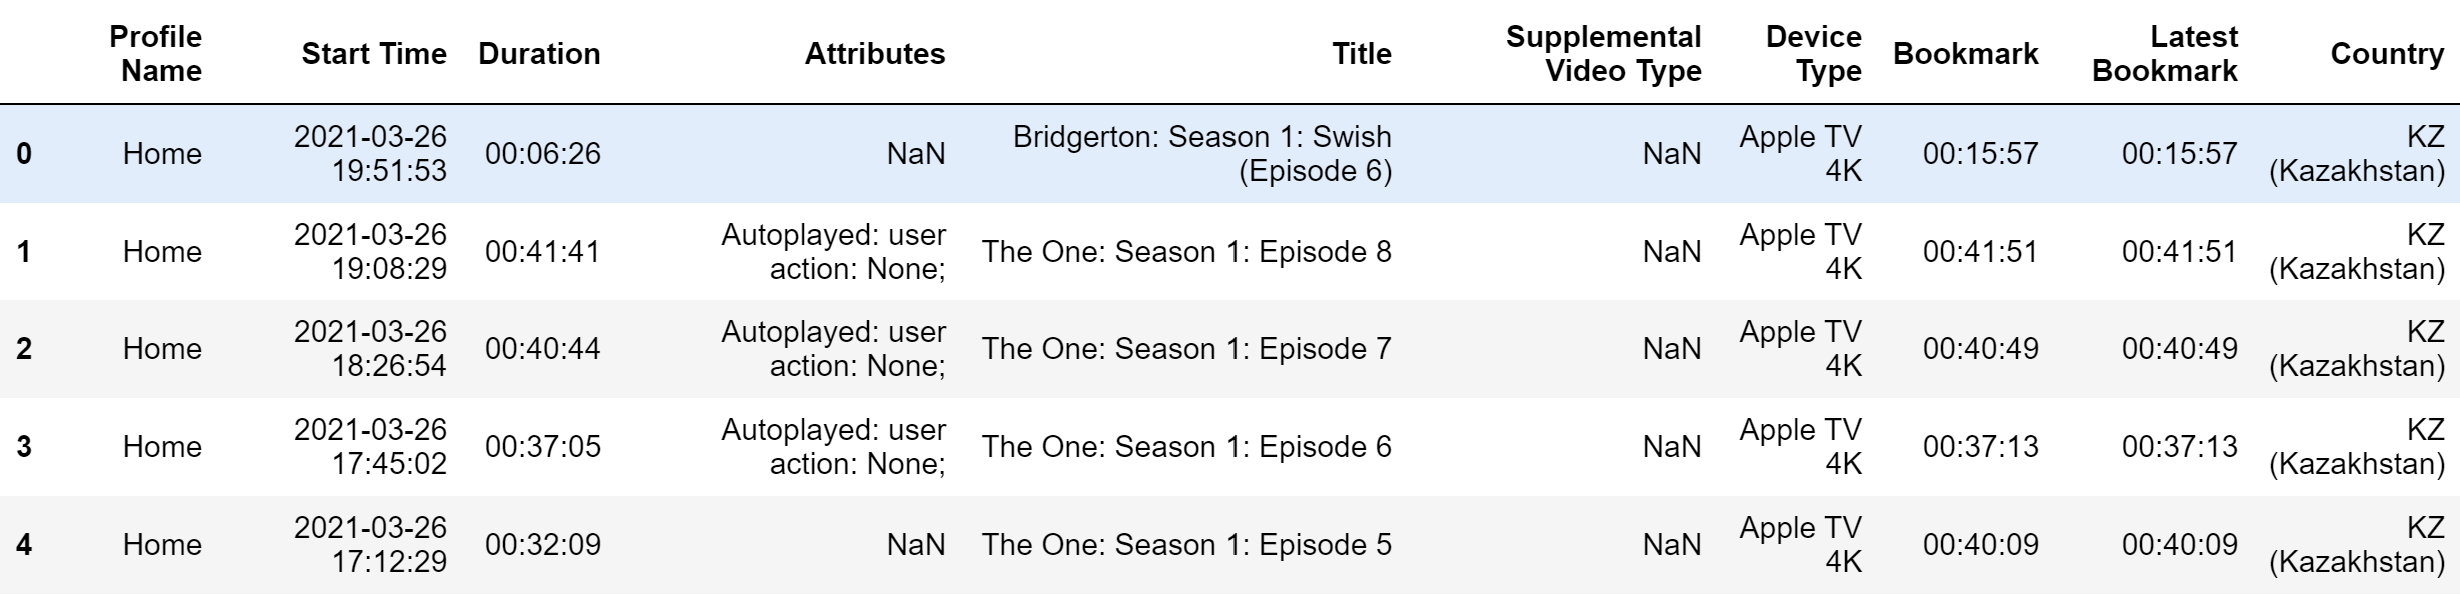
They sent me the “Content interaction” folder with several CSV files about my viewing activity. The most interesting for me was the ViewingActivity.csv file with timestamps and titles.
import pandas as pd
import numpy as np

df = pd.read_csv('ViewingActivity.csv')
df.head()
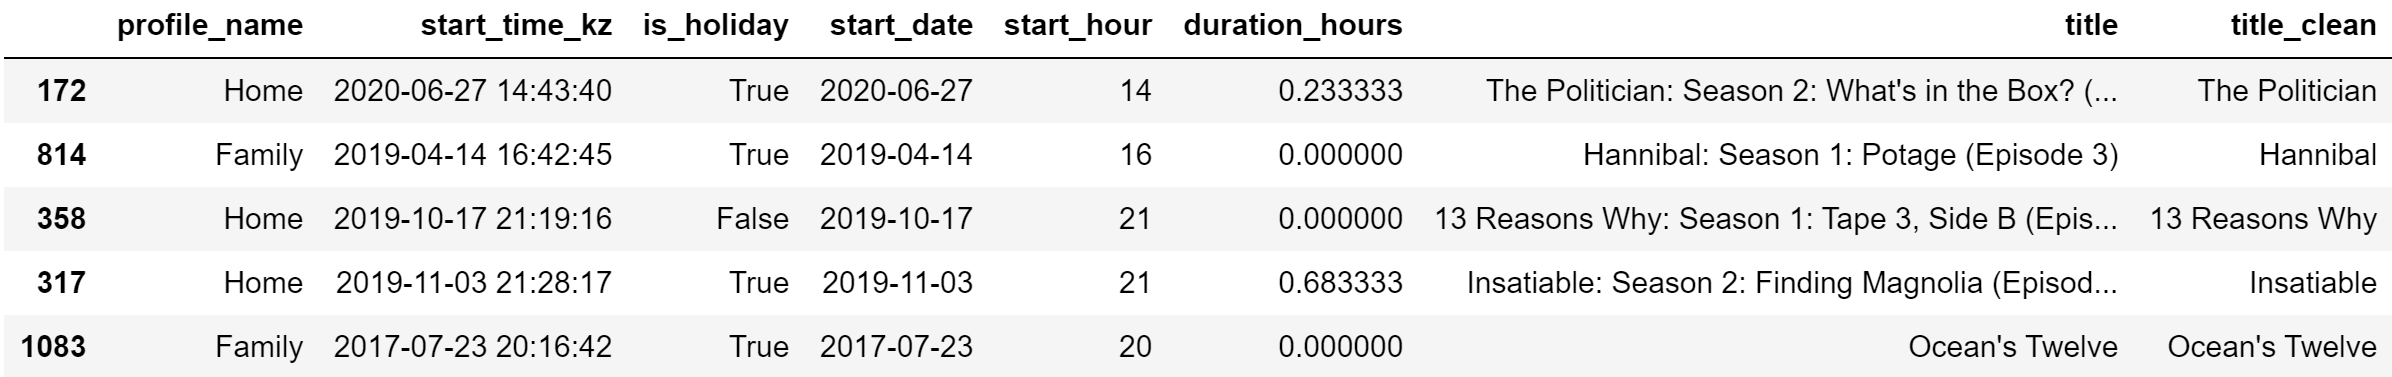
I performed basic data cleaning for further analysis:
df_clean = (
    df
    .rename(columns=lambda x: x.lower().replace(' ', '_')) # Normalize column names
    .loc[lambda x: x['supplemental_video_type'].isnull()] # Remove supplementals (trailers, teasers, etc)
    .assign(
        start_time     = lambda x: pd.to_datetime(x['start_time']),
        start_time_kz  = lambda x: x['start_time'] + pd.DateOffset(hours=6), # Convert to UTC +6 (Kazakhstan, Almaty)
        duration       = lambda x: pd.to_datetime(x['duration'], format='%H:%M:%S'),
        duration_hours = lambda x: x['duration'].dt.hour + x['duration'].dt.minute / 60,
        title_clean    = lambda x: x['title'].str.replace(': (?i)(part|season|volume|limited series|series|chapter)(.*)', '').str.strip(),
        start_date     = lambda x: x['start_time_kz'].dt.date,
        start_hour     = lambda x: x['start_time_kz'].dt.hour,
        is_holiday     = lambda x: x['start_time_kz'].dt.weekday >= 5,
    )
    [['profile_name', 'start_time_kz', 'is_holiday', 'start_date', 'start_hour', 'duration_hours', 'title', 'title_clean']]
)

df_clean.sample(5)
Enrich Viewing Activity with IMDB data
As you may have noticed, I have more than two profiles – Home and Family. I wanted to check if hourly activity, genres and countries preference are different for them. Unfortunately, Netflix doesn’t show movies metadata in their datasets, but you know who does? IMDb :)
I found a handy IMDbPY Python package to retrieve the data about a movie based on its ID or title. I wrote a function that takes movie title, looks for it in the IMDb database, takes ID from the first search result and returns metadata based on it.
from imdb import IMDb

ia = IMDb()

def get_movie_info(movie_title):
    '''
    Returns a dict with movie metadata based on a Movie title
    '''
    search_result = ia.search_movie(movie_title)

    if search_result:
        movie_id = search_result[0].getID()
        movie = ia.get_movie(movie_id)

        return {
            'netflix_title': movie_title,
            'imdb_title'   : movie['title'] if 'title' in movie else None,
            'year'         : movie['year'] if 'year' in movie else None,
            'genre'        : movie['genres'] if 'genres' in movie else None,
            'country'      : movie['countries'] if 'countries' in movie else None
        }
    print(f'{movie_title} not found')
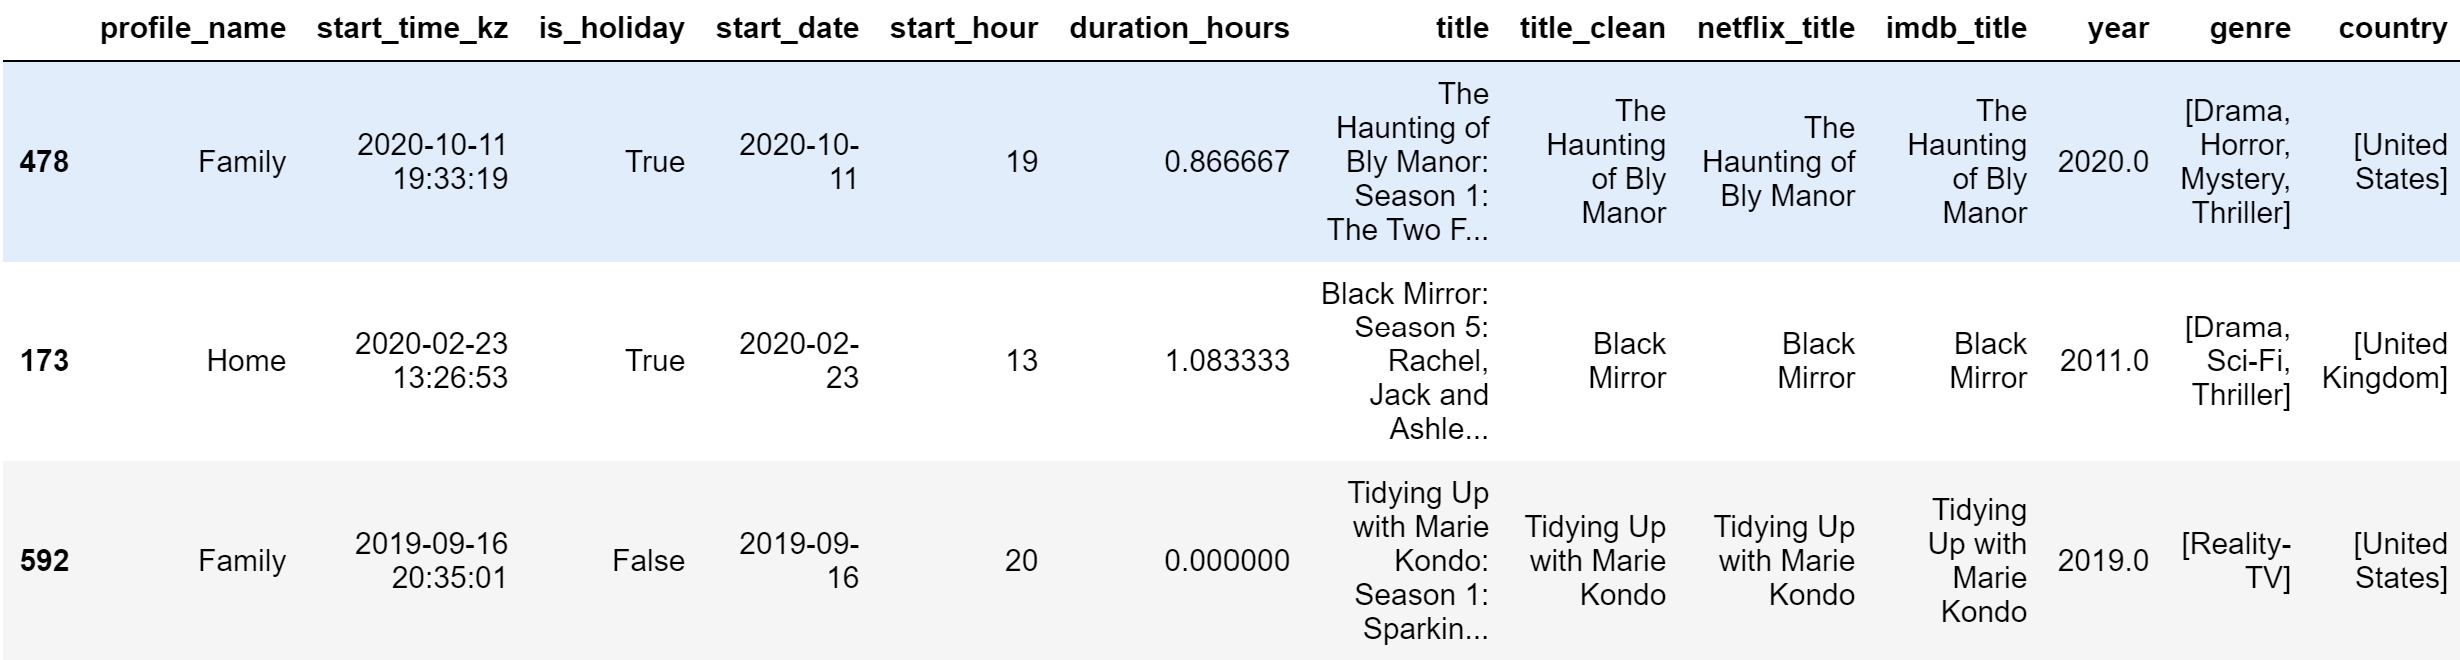
Then simply iterate through all the titles from the title_clean column, find the full code here. That’s how the final table:
df_merged.sample(3)
Analysis
Summary
Finally, we can get to data analysis! First, let’s look at summary statistics.
from pprint import pprint
from IPython.display import display, HTML, Markdown

import matplotlib.pyplot as plt
import seaborn as sns
def make_summary(df):
    return (
        df
        .rename(
            columns={
                'profile_name': 'Profile',
            }
        )
        .groupby('Profile')
        .agg(
            sessions = ('start_time_kz', 'count'),
            freq_hour = ('start_hour', pd.Series.mode),
            total_duration = ('duration_hours', 'sum'),
            days = ('start_date', 'nunique')
        )
        .assign(
            hours_per_day = lambda x: x['total_duration'] / x['days']
        )
        .rename(
            columns={
                'sessions': 'Sessions',
                'freq_hour': 'Most Frequent Hour',
                'total_duration': 'Total Hours',
                'days': 'Days',
                'hours_per_day': 'Hours per Day'
            }
        )
        .style.format({
            'Total Hours': '{:.0f}',
            'Hours per Day': '{:.2f}'
        })
    )

make_summary(df_merged)
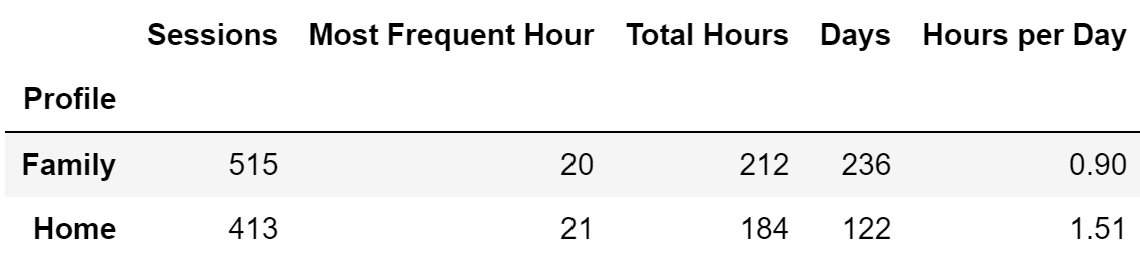
On average, we spend from 1 to 2 hours per day watching movies or shows at 8-9 PM.
Genres
Now let’s look at the Top 5 genres and countries from viewing history:
def make_top(df, column, top_size=5):
    df_top_5 = (
        df
        .explode(column)
        .groupby(['profile_name', column])
        .agg(
            n_movies = ('title_clean', 'nunique')
        )
        .sort_values(by=['profile_name', 'n_movies'], ascending=[True, False])
        .reset_index()
        .groupby('profile_name')
        .head(top_size)
        .rename(columns={'n_movies': '# Movies'})
    )

    for i in range(len(profile_names)):
        profile_name = profile_names[i]

        plt.figure(figsize=(7, 4))

        sns.barplot(
            data=df_top_5.loc[lambda x: x['profile_name'] == profile_name],
            x=column,
            y='# Movies',
            color=colors[i],
            saturation=1
        )
        plt.title(f"{profile_name}")
        plt.legend([],[], frameon=False)
        plt.ylim(0, np.ceil(df_top_5['# Movies'].max() / 10) * 10)
        plt.xlabel('')

        for spine in plt.gca().spines.values(): # remove border lines
            spine.set_visible(False)

        plt.savefig(f'{column}_{profile_name}.png', dpi=200)
        plt.show()
colname = 'genre'
make_top(df_merged, colname)
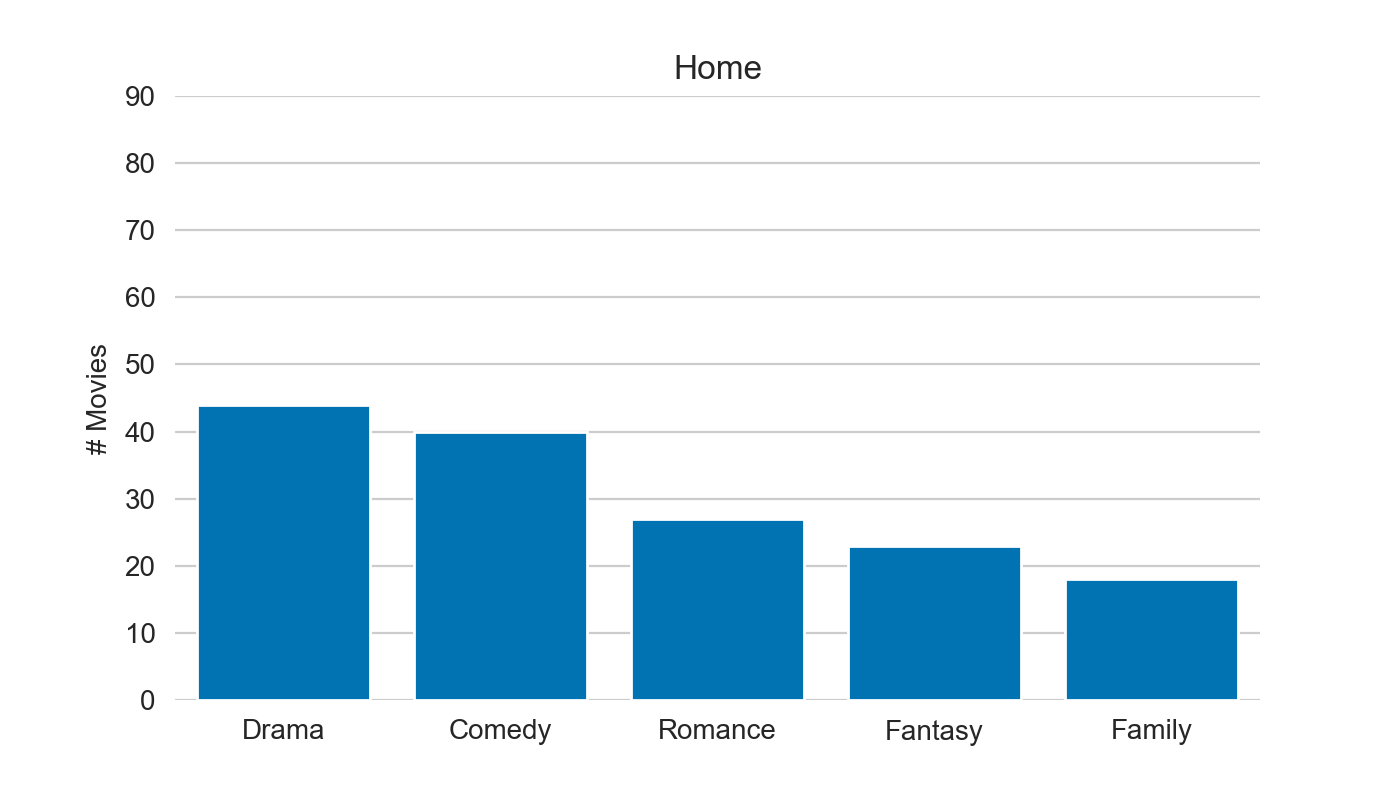
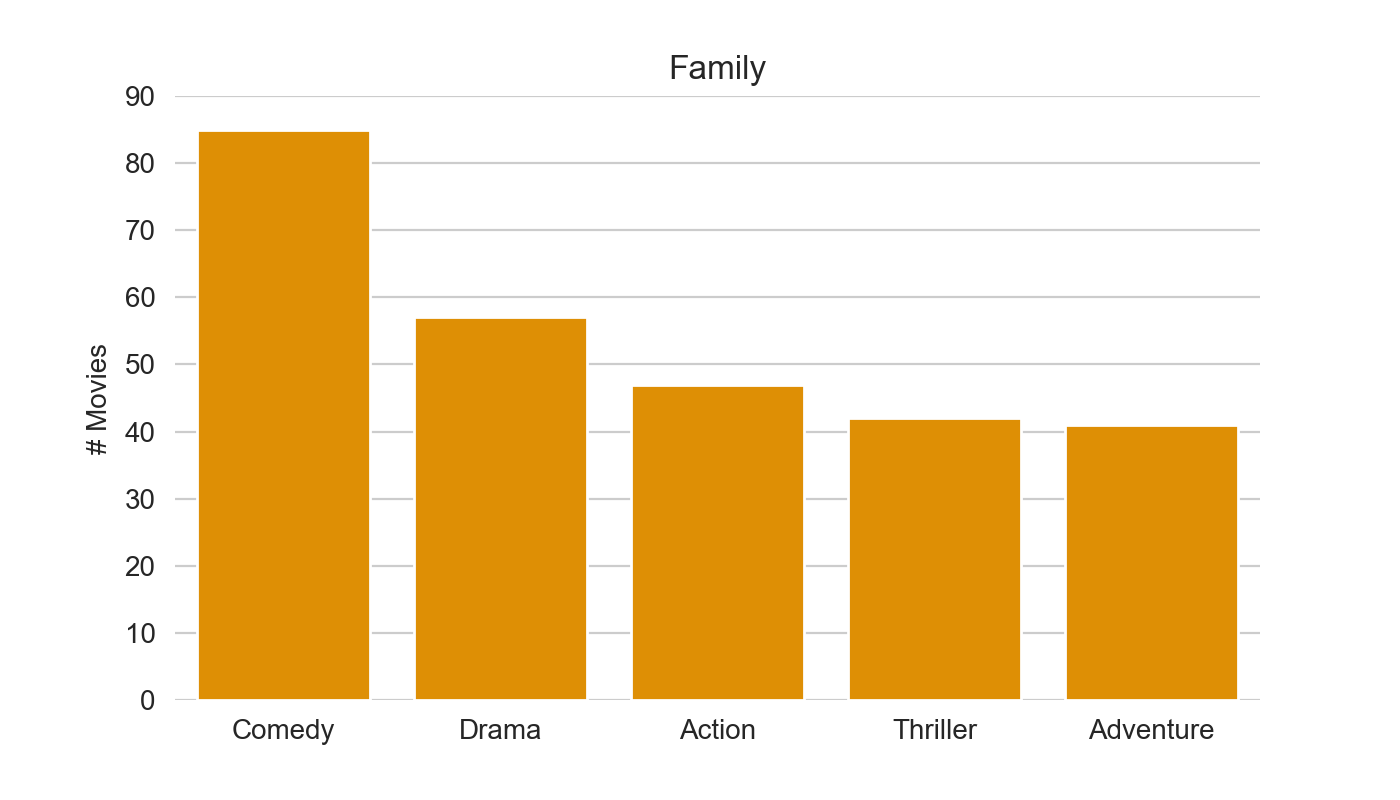
Interestingly we see quite different preferences in the profiles :)
Countries
colname = 'country'
make_top(df_merged, colname)
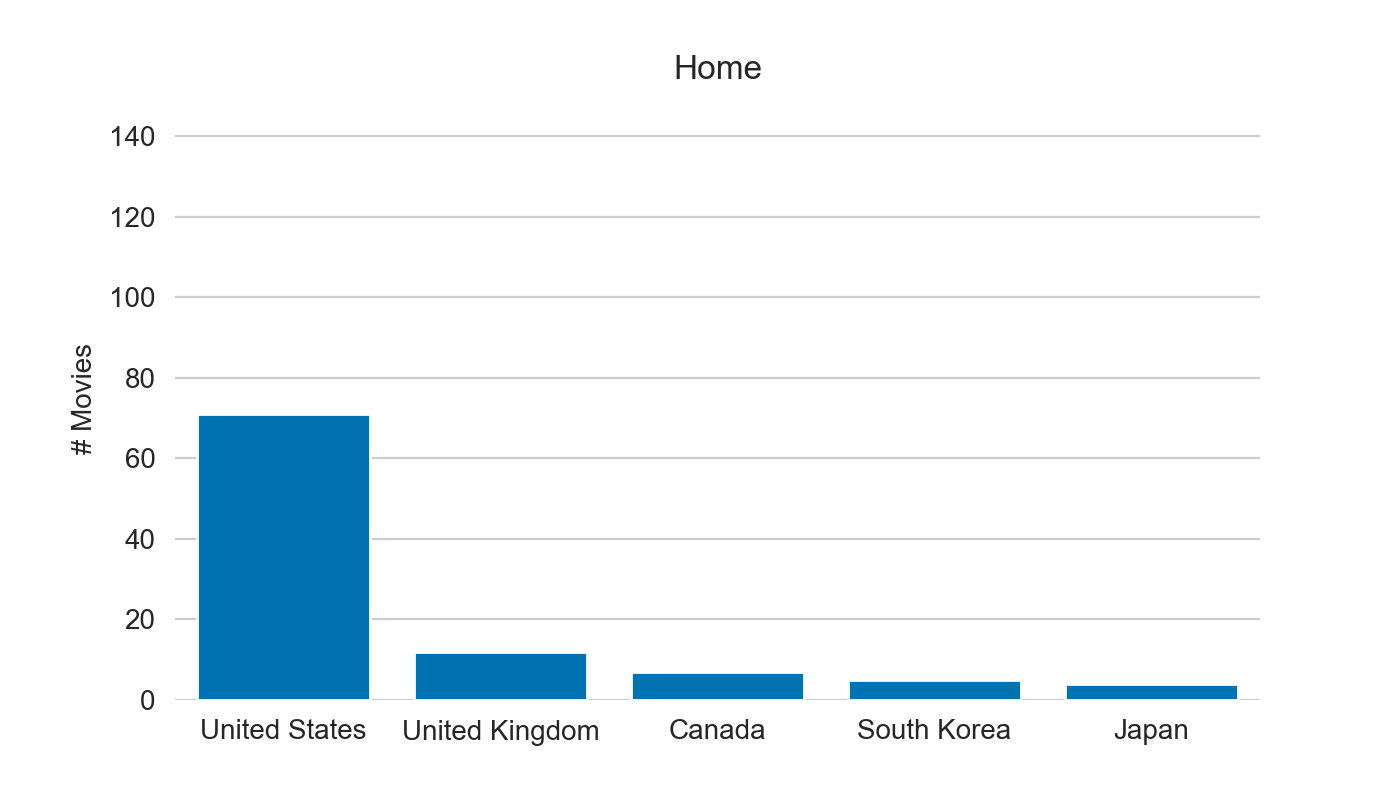
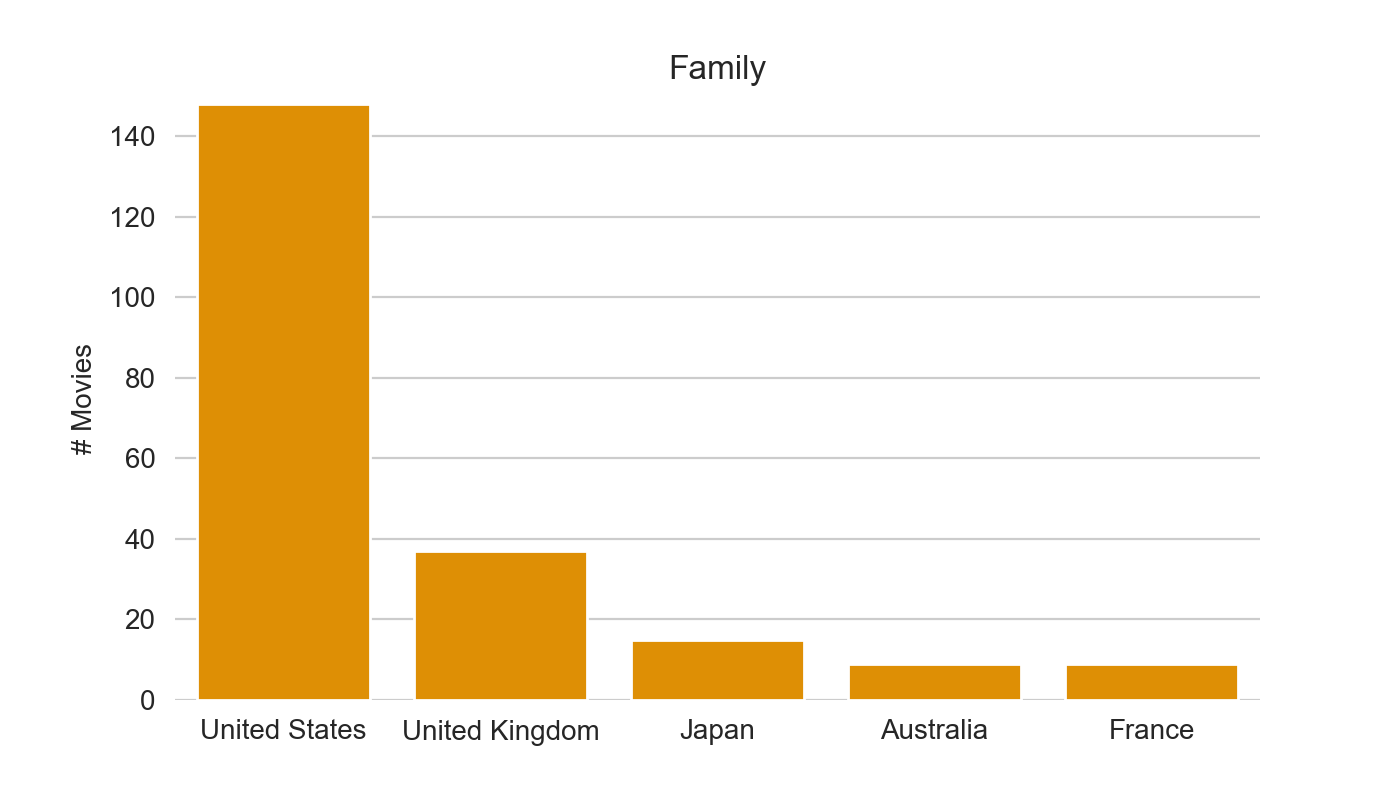 It’s hard to judge as most of the content on Netflix is from the US, but positions from 3 to 5 differ.
Hours activity
Last, let’s look at hour distribution, i.e. what time of the day and week we watch the most of shows.
def analyze_hours(df, y_lim):

    for is_holiday in [False, True]:

        titles = {True: 'Weekend', False: 'Workdays'}

        plt.figure(figsize=(7, 4))

        sns.kdeplot(
            data=df.loc[lambda x: x['is_holiday'] == is_holiday],
            x='start_hour',
            hue='profile_name'
        )

        plt.title(f"{titles[is_holiday]}")
        plt.legend([],[], frameon=False)
        plt.xlabel('Start Hour')
        plt.grid(b=False, which='both', axis='x')
        plt.ylim(0, y_lim)

        for spine in plt.gca().spines.values():
            spine.set_visible(False)

        plt.savefig(f'hours_{titles[is_holiday]}.png', dpi=200)
        plt.show()
analyze_hours(df_merged, y_lim=0.06)
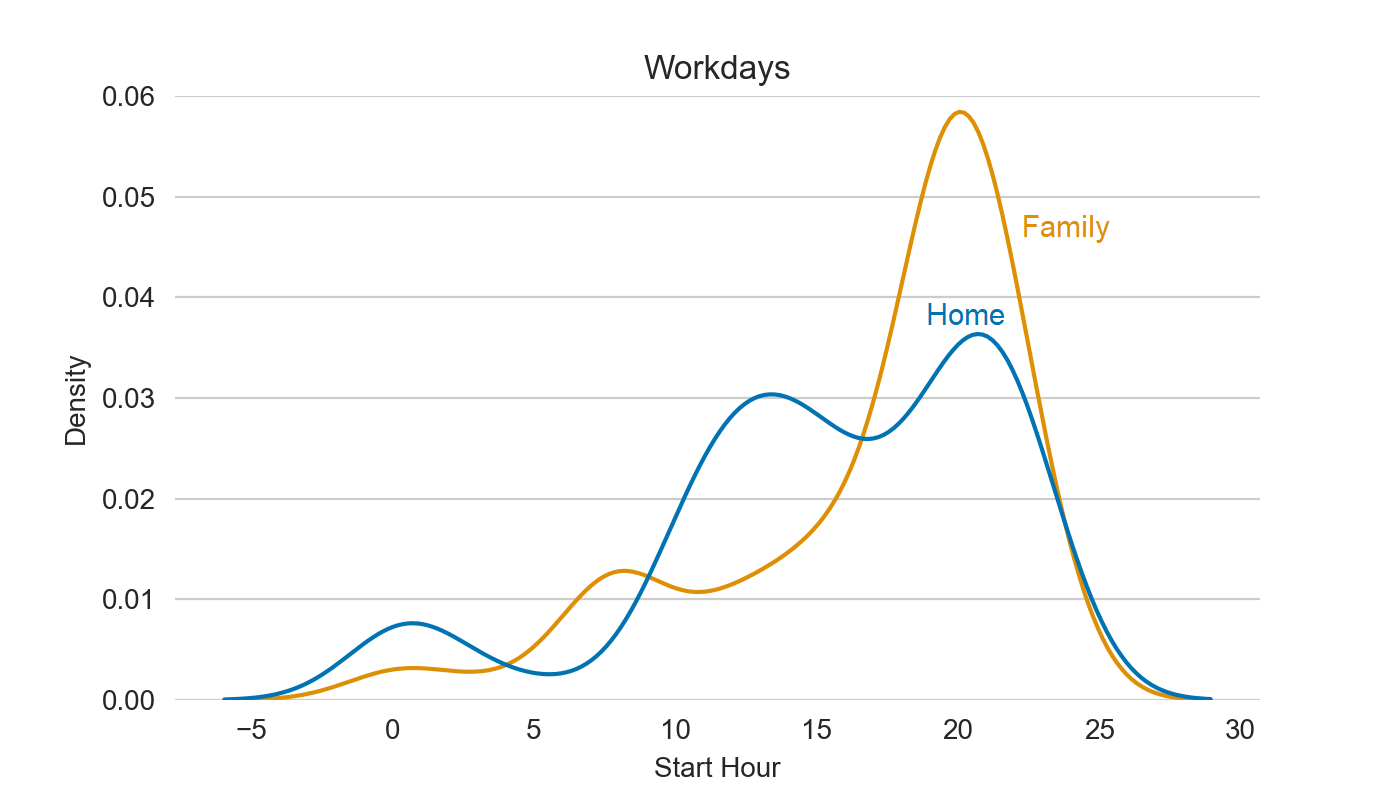
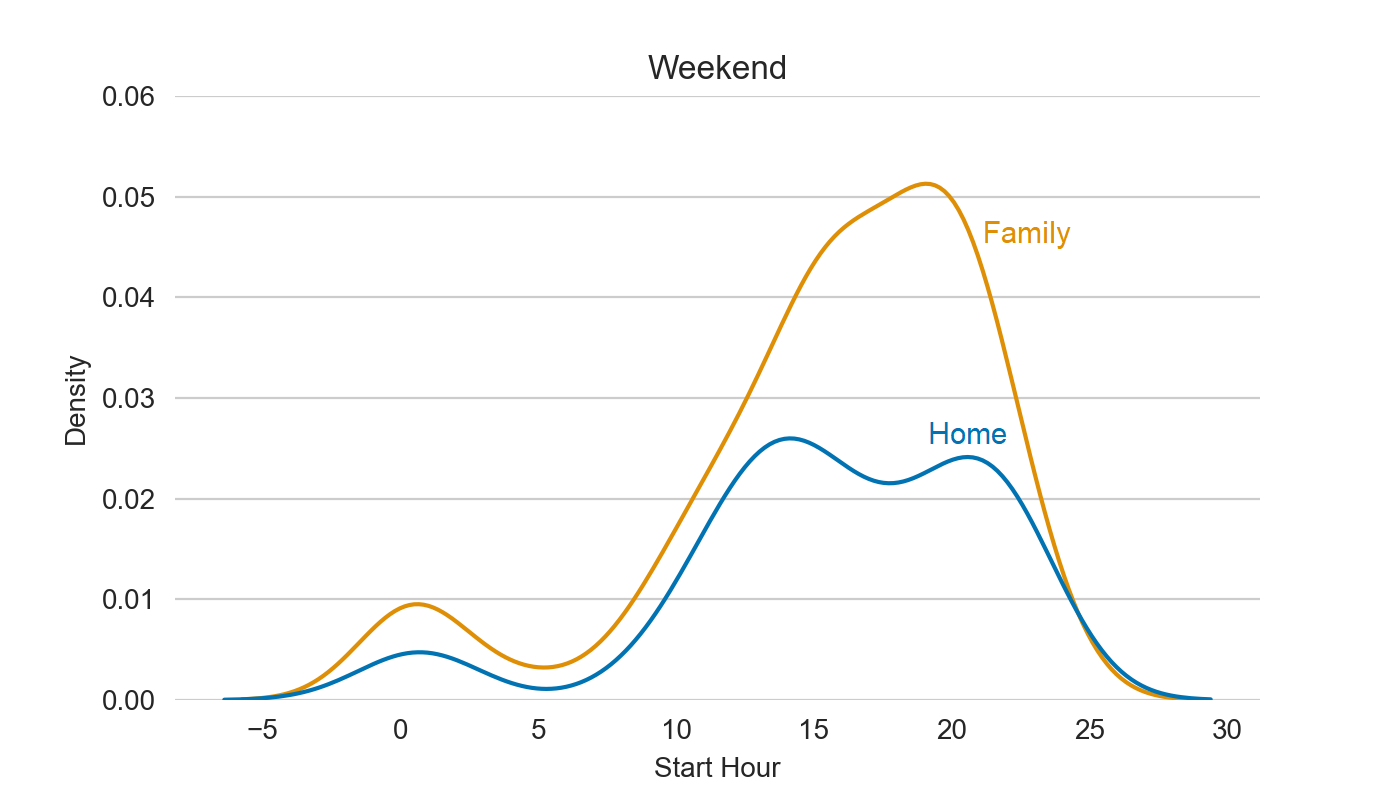
Home profile has two peaks – the afternoon and the evening, while Family one is most active in the evening, though it’s different on workdays and weekends :)
Thanks for reading this, hope that helped 😊. You can find the full code here.