How to analyze investment portfolio using Python, Part 1: Data Analysis
General idea
I am investing for over a year now, so I would like to analyze my portfolio and compare it with the S&P 500 benchmark. The question is, what if I bought S&P 500 ETF instead of my portfolio strategy on the exact dates for the same amount? Would it be more efficient?
My broker is TD Ameritrade, so this article is based on their API data analyzed in Python, but you can apply this idea to any broker and tool of your own.
Connecting to API
I am going to use the td-ameritrade-python-api package, go through the documentation or video tutorials to learn more about authorization flow and usage. Let’s start a new session: for the first time, the package will ask you to authorize your app in TD Ameritrade, then it will store acquired credentials in the YOUR_PATH.json file, so you won’t need to re-authorize every time.
# pip install td-ameritrade-python-api
from td.client import TDClient

CONSUMER_KEY = # YOUR KEY
REDIRECT_URI = # YOUR REDIRECT URL
TD_ACCOUNT = # YOUR TDA ACCOUNT ID

# Create a new session, credentials path is optional.
TDSession = TDClient(
    client_id=CONSUMER_KEY,
    redirect_uri=REDIRECT_URI,
    credentials_path='YOUR_PATH.json'
)

# Login to the session
TDSession.login()
Get your current portfolio
First, I get information about my current Positions and prepare the data a bit.
import pandas as pd
import numpy as np

# Raw data from TD Ameritrade API
positions = TDSession.get_accounts(account=TD_ACCOUNT, fields=['positions'])
df_positions = pd.DataFrame(positions['securitiesAccount']['positions'])

# Clean dataframe, ready for the analysis
df_portfolio = (
    pd.concat(
	    [
		    df_positions.drop('instrument', axis=1),
		    df_positions['instrument'].apply(pd.Series)
	    ],
	    axis=1
    )
    .loc[lambda x: x['assetType'] == 'EQUITY'] # Exclude cash balance
    [['symbol', 'marketValue']]
)

# Current Market Value
portfolio_market_value = df_portfolio.marketValue.sum()
Get S&P 500 data
Now we need to simulate purchases of S&P 500 ETF: I am going to use VOO ticker.
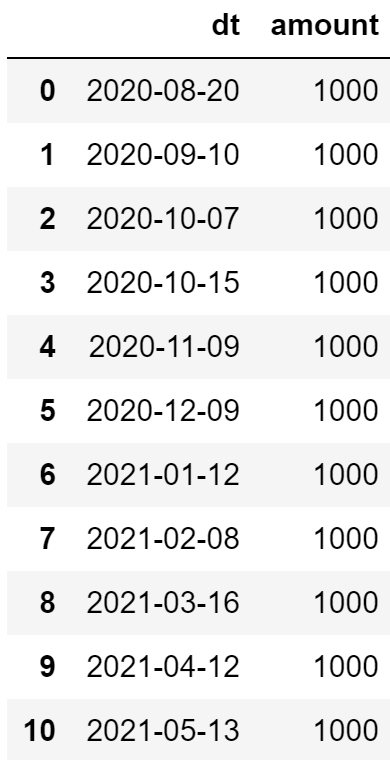
Get transactions dates and their amount for tickers in current portfolio
# BUY Transactions history from Ameritrade API
transactions = TDSession.get_transactions(account=TD_ACCOUNT, transaction_type='BUY_ONLY')

# Dataframe with transactions dates and their amount aka volume
df_buys = (
    pd.json_normalize(transactions)
    .loc[lambda x: x['transactionItem.instrument.symbol'].isin(df_portfolio.symbol)] # Include only tickers from current portfolio (current strategy)
    .rename(columns={
        'netAmount': 'amount',
        'transactionDate': 'dt'
    })
    [['dt', 'amount']]
    .assign(
        dt = lambda x: pd.to_datetime(x['dt']).dt.date,
        amount = lambda x: -x['amount'] # Get a positive number
    )
    .groupby(['dt'], as_index=False)
    ['amount']
    .sum()
)

df_buys
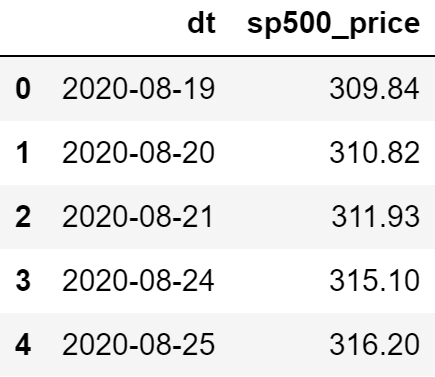
Get prices of VOO ticker at these dates
import datetime
import yfinance as yf

# Get VOO ticker price history using Yahoo Finance data
sp500_etf = 'VOO'
start = df_buys['dt'].min()
end = df_buys['dt'].max() + datetime.timedelta(days=1) # Include the last day

df_sp500 = yf.download(sp500_etf,
                      start=start,
                      end=end,
                      progress=False)
# Clean the data
df_sp500_clean = (
    df_sp500
    .reset_index()
    .rename(columns={
        'Date': 'dt',
        'Close': 'sp500_price'
    })
    [['dt', 'sp500_price']]
    .assign(
        dt = lambda x: pd.to_datetime(x['dt']).dt.date
    )
)

df_sp500_clean.head()
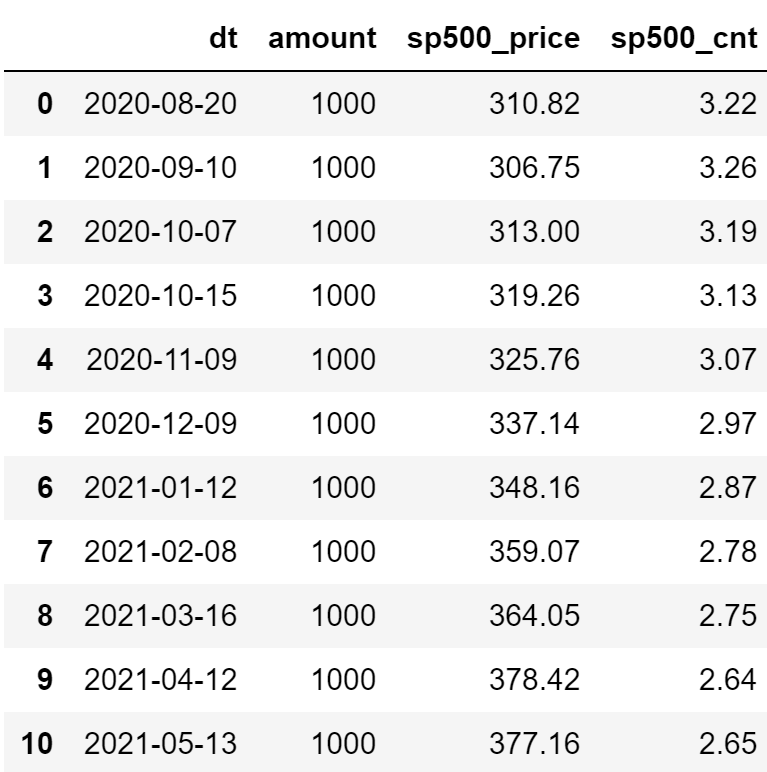
Calculate quantity of VOO quotes bought based on amount and price
df_buys_w_sp500 = (
    df_buys
    .merge(df_sp500_clean, how='left', on='dt')
    .assign(
        sp500_cnt = lambda x: x['amount'] / x['sp500_price']
    )
)

df_buys_w_sp500
Calculate current market value for this quantity
sp500_current = yf.Ticker(sp500_etf).history(period='1d')['Close'][0]
sp500_market_value = df_buys_w_sp500.sp500_cnt.sum() * sp500_current
Compare two portfolios
Finally, let’s see the difference between two portfolios. I wrote a simple functions for that: it takes name of your portfolio, open balance and market value to print summary:
def portfolio_summary(name, open_balance, market_value):
    print(f"{name}\n")
    print(f"Open Balance: ${open_balance:,.2f}")
    print(f"Market value: ${market_value:,.2f}")
    print(f"Profit: ${market_value - open_balance:,.2f} ({(market_value - open_balance) / open_balance:,.2%})")

open_bal = df_buys_w_sp500.amount.sum()
S&P 500 simulation
portfolio_summary('S&P 500 Portfolio only', open_bal, sp500_market_value)
# S&P 500 Portfolio only
#
# Open Balance: $11,000.00
# Market value: $12,290.70
# Profit: $1,290.70 (11.73%)
Current portfolio
portfolio_summary('Current Portfolio', open_bal, portfolio_market_value)
# Current Portfolio
#
# Open Balance: $11,000.00
# Market value: $12,286.78
# Profit: $1,286.78 (11.70%)
As for today, Profit values are around the same and show growth of 11.7% for less than a year. Not bad!
Hope this article will help you analyze your own investment portfolio, you can find the code here.